Business Reporting Tools Turning Data into Information & Information into Insight.

Analysis has never been easier or more profitable with the Giddh Dashboard and its advanced business reporting tools! Every growing business eventually outgrows traditional methods of financial reporting. As data complexity increases, traditional reporting methods become less effective.
When your business needs more detailed insights and real-time metrics, it’s time to upgrade to a more powerful business intelligence tool. This is where Giddh’s business reporting tools steps in, offering the comprehensive solutions you need to scale and make data-driven decisions.
How to Improve Business Reporting for Growth?
As your business grows, gaining deeper visibility into business financials and operational data becomes increasingly important. Decision-makers need insights not only into what's happening but also into what’s driving growth and how to maintain momentum.
Financial professionals are constantly tasked with managing business reporting that is:
-
On-demand — To quickly identify issues and solve problems anytime, anywhere.
-
Real-time — For the most current and up-to-date data.
-
Relevant to Every Vertical — Different stakeholders, such as management, admin, investors, and partners, interpret numbers differently, so data needs to be adaptable.
-
Available in Comprehensible Formats — To meet varying needs for actionable insights and make complex data simple for every team.
These challenges cannot be met with the outdated, spreadsheet-based reporting methods, especially when your business relies on accurate, real-time data to drive strategy. This is where business intelligence tools and business reporting software come into play, offering the scalability and efficiency required for modern businesses.
What is Business Reporting?
Also known as enterprise reporting, business reporting is basically “the public reporting of operating and financial data by a business enterprise,” and “the regular provision of information to decision-makers within an organization to support them in their work.” It’s an initiative by companies and organizations to move towards the sphere of business intelligence and knowledge management.
What are Business Reporting Tools?
Business reporting software or business reporting tools are application software that can help collect volumes of unstructured data from internal and external systems, such as books, journals, email, video, and images. They help identify information using queries.
They can also help prepare data for analysis to create reports, dashboards, and data visualisations. This can empower both employees and managers to make accurate decisions, improve operational efficiency, analyse market trends, and identify KPIs and new revenue opportunities.
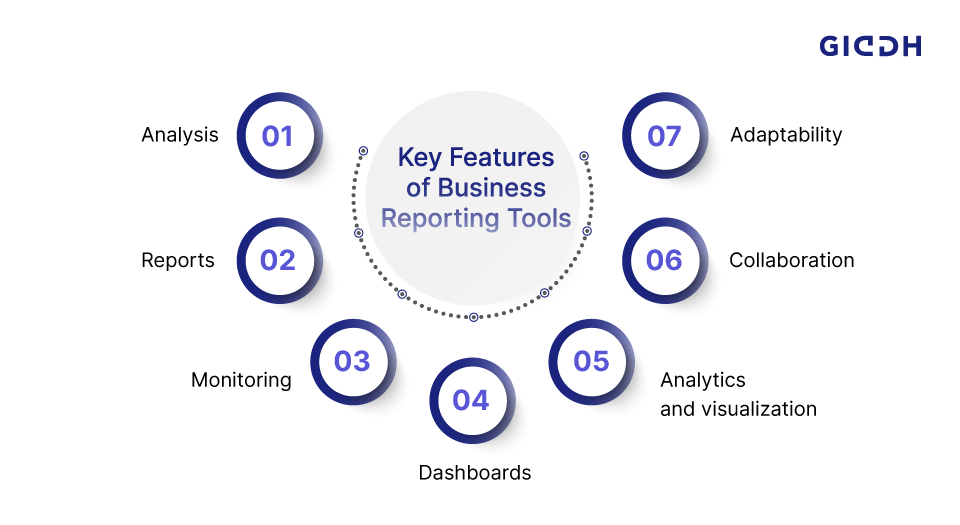
What Are The Key Features Of Business Reporting Tools?

The best business reporting tools have several functionalities, such as:
- Analysis – The reporting tools help analyse raw data, factoring in seasonality, trends, and scenarios
- Reports – The business reporting tools help create reports for better analysis of the data
- Monitoring – Real-time monitoring of the operational data can help businesses make informed decisions
- Dashboards – The business reporting software offers a dashboard where businesses can monitor, measure, and manage performance all in one place.
- Analytics and visualization – One of the most important functionalities of business intelligence software is the ability to get advanced analytics and visualisation options to analyse them.
- Collaboration – You can also choose to collaborate on the different aspects of the reports or data with internal departments or external partners.
- Adaptability – Finally, with the rise in the use of mobile devices, reports and data can be easily accessed on any mobile device.
Enhance Business Reporting and Insights with Giddh's Cloud-Based Solutions
Taking your reporting capabilities to the next level requires taking your software to the next level and to the cloud with Giddh. With Giddh, your team can leverage built-in accounting and financial reporting. You’ll have the tools to:
-
Expand and Improve Visibility on Activities
As any growing business needs, with Giddh, you will be able to view activities that concern your business, such as audit logs that populate a list of all activities of deletion or creation in your accounts, and a daybook that lists out every financial activity done. That means more data, more reports, more information, and more insight.
With Giddh’s trial balance, profit/loss statements, and balance sheet, your team will have access to big-picture as well as granular insights in just a few clicks.
-
Analyse your Business from Any Angle
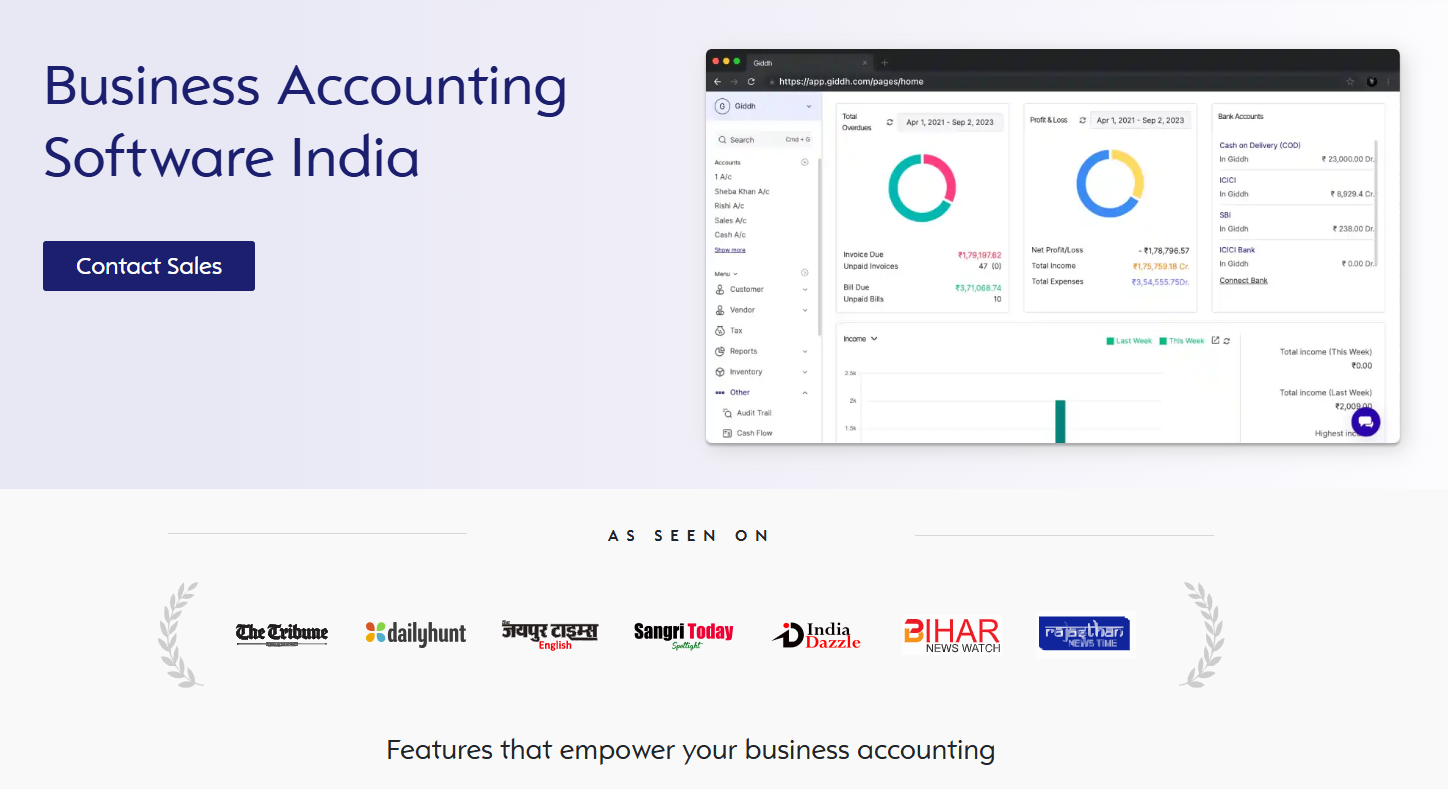
With the Giddh dashboard, you’ll improve decision-making and get faster answers to your questions by analysing performance based on your company’s financial day-to-day activities.
Giddh’s Dashboards includes ten built-in tools for capturing and reporting on business context: total receivables-payables, net worth, expense, revenue, and financial year. And ratio analysis small business reporting tools with current ratio, debt equity ratio, proprietary ratio & fixed ratio.
With this data-driven reporting, your team will be able to analyse, evaluate, and summarise your financial data so it’s most relevant for the problem being solved. This functionality helps you meet the needs of decision-makers across your company, whether they’re in finance, sales, marketing, or operations.
And since you’re not manually importing data to form these charts and graphs, your information is always up-to-date in real-time. That means you can create a roadmap for your business in both lthe ong and short term and in a variety of ways.
-
Share the Insights with Ease
You can run reports and share them on demand. Even your team or whoever you have shared your company with will be able to choose from flexible delivery options like email, so insights can be pushed out when it’s most convenient. And reports can be output in PDF, CSV, or Excel format, whatever works best for the person who needs them.
Giddh’s reporting statements and its dashboard open a new and exciting world of reporting to your business. And it’s designed to scale so it can grow with you as your company expands and your reporting needs change. You can read more on how you can do more with the Giddh dashboard here.
Conclusion
Efficient business reporting tools are essential for any growing company looking to make informed decisions based on accurate, real-time data. By leveraging advanced business intelligence tools and software like Giddh, you can easily manage financial reporting, track key performance indicators, and gain actionable insights.
With Giddh, you can automate your reporting processes, ensuring that your team has up-to-date information available anytime they need it. From financial dashboards to real-time analytics, Giddh simplifies the way businesses handle their data, making it easier to monitor progress and drive better decision-making.
Start using Giddh today and experience how business reporting software can enhance your operations.


