Financial Reporting Automation vs Manual Reporting
Finance teams globally lose an average of 30,000 hours per year on manual data gathering and report preparation alone — time that translates directly into delayed decisions, missed signals, and strained teams.
That’s not a rounding error. That’s the equivalent of 15 full-time employees working year-round on tasks that, in many cases, software can handle overnight.
So why are so many growing businesses still relying on spreadsheets for their financial reporting? Because switching feels risky, expensive, and complicated. And most resources on this topic either pitch automation as a cure-all or dismiss manual reporting without giving finance professionals the honest breakdown they actually need.
This guide does something different. It gives you a straight, detailed comparison of financial reporting automation vs manual reporting — the real costs, the real risks, and a practical framework for deciding what makes sense for your business at its current stage.
Whether you’re a CFO at a 200-person B2B company or a Finance Manager staring down another brutal month-end close, this is written for you.
What Is Financial Reporting and Analysis? The Foundation You Cannot Afford to Get Wrong
Financial reporting is the systematic preparation and presentation of financial statements that communicate a company’s financial position to management, investors, regulators, and other stakeholders.
The core outputs — income statement, balance sheet, and cash flow statement — are not formalities. They are the operating intelligence of a business.
Financial reporting and analysis together form a two-part function: reporting captures the what (revenue, expenses, liabilities, equity at a specific point in time), while analysis answers the why (why did margins contract this quarter, where is cash being consumed, which cost centres are over-budget).
Most finance teams are strong on the former and stretched thin on the latter, largely because the former consumes too much time.
The evolution of financial reporting has followed a simple pattern: each method served its era until transaction volume and business complexity outgrew it.
- Paper ledgers → worked for small, single-entity businesses with low transaction frequency
- Spreadsheets → worked for growing businesses, managing moderate volume and multiple data sources
- Cloud-based automation → necessary when reporting cycles, regulatory requirements, and data sources multiply beyond what spreadsheets can reliably handle
The industry is not debating whether automation is coming; it is debating how to prepare for it. That debate is over. The question is where your business sits on that curve, and whether the tools you’re using match the complexity you’re managing.
What Is Manual Financial Reporting — And Where Does It Actually Work?
Manual financial reporting is exactly what it sounds like: finance professionals manually extracting data from multiple sources, accounting software, bank statements, ERP outputs, departmental spreadsheets, entering it into a central workbook, applying formulas, validating figures, formatting outputs, and distributing reports to stakeholders. The process relies entirely on human effort at every stage.
Where manual reporting still makes sense
Most competitors skip this part. Manual reporting is not categorically wrong — it is wrong at the wrong scale. It genuinely works for:
-
Sole traders and micro-businesses with fewer than 20 monthly transactions and no multi-entity complexity.
-
Pre-revenue startups with no formal reporting cadence or investor obligations yet.
-
Highly bespoke one-off reports that require custom narrative framing, no template can replicate.
Outside those contexts, manual reporting starts to accumulate costs that rarely appear in any line item.
The honest pros
• Zero upfront software cost and no implementation timeline
• Total control over data formatting and report presentation
• No vendor dependency, no integration risk, no contract to manage
The real cons — backed by data
Time drain: PwC research shows that automating financial processes can save up to 40% of a finance team’s time. Inversely, that same 40% is currently being consumed by manual work. For a four-person finance team, that is the equivalent of 1.6 full-time roles spent on tasks that generate no analysis, no insight, and no strategic value.
Error exposure:
Companies using automated financial reporting systems report a 90% reduction in data entry errors. Manual processes introduce formula risk, version control failures, and copy-paste errors that compound across reporting cycles — the ‘spreadsheet single point of failure’ that finance teams know all too well.
Scalability ceiling:
Manual reporting does not scale proportionally. As transaction volume grows, reporting time grows faster. A business managing 500 transactions a month faces a fundamentally different manual reporting burden than one managing 5,000.
Key person dependency:
If your most experienced Excel user is on leave during the month-end close, your entire reporting cycle is at risk. That is not a people problem. That is a process architecture problem.
What Is Financial Reporting Automation — And How Does It Work End-to-End?
Financial reporting automation is the use of accounting software to automatically collect data from connected financial systems, consolidate it across entities and accounts, perform calculations, apply pre-defined rules, and generate accurate reports — with minimal or zero manual data entry at any stage.
Understanding what that looks like in practice matters because ‘automation’ is used loosely. Here is the actual end-to-end workflow:
-
Data ingestion — the system pulls live, structured data directly from connected sources: your ERP, accounting platform (QuickBooks, Tally, Zoho Books, SAP), bank feeds, CRM, payroll platform, and expense management tools. No manual export, no copy-paste.
-
Consolidation and cleansing — data is standardised across formats, currencies are converted at configured rates, and figures are mapped to your chart of accounts automatically.
-
Auto-calculation — variance analysis, financial ratios, trend comparisons, and period-over-period formulas are applied consistently every cycle without human input.
-
Report generation — balance sheets, income statements, cash flow statements, and custom management reports are produced using pre-built or configured templates.
-
Distribution — reports are delivered to stakeholders through secure, role-based access channels. Board-level reports go to board members. Department summaries go to department heads. No email attachments with sensitive financials.
-
Audit trail — every data point, calculation, change, and access event is timestamped and logged. This is not optional compliance infrastructure — it is built into every cycle.
-
The technologies powering modern financial reporting automation include Robotic Process Automation (RPA) for repetitive data tasks, AI and machine learning for anomaly detection and variance flagging, OCR for invoice and document capture, and cloud API integrations for real-time data connectivity.
Studies show that financial automation can lead to over 80% improvement in financial team productivity, with up to 2x faster financial close and 2–3x faster billing cycles. — Cube Software Research
Financial Reporting Automation vs Manual Reporting: A Complete Side-by-Side Breakdown
Not every factor carries equal weight for every business. A 50-person company and a 500-person company face fundamentally different reporting complexities. Size, growth stage, transaction volume, regulatory obligations, and investor reporting requirements all shift how this comparison lands.
What follows is a full breakdown, followed by the analysis that actually matters for decision-making.
Factor | Manual Reporting | Financial Reporting Automation |
|---|---|---|
Speed | Days to weeks per close cycle | Hours or real-time |
Accuracy | High error risk from manual entry and formulas | Significantly fewer errors with automated validation |
Scalability | Breaks as transaction volume and entities grow | Scales without proportional effort increase |
Cost | Low upfront but high hidden labor cost | SaaS investment with strong long-term ROI |
Compliance & Audit | Manual trails and inconsistent documentation | Automated, timestamped audit trails |
Real-time Visibility | Delayed, snapshot-based reporting | Live dashboards and continuous updates |
Data Security | Shared files and unsecured access | Role-based access and encryption |
Team Bandwidth | Spent on data entry and reconciliation | Focused on analysis and strategy |
Key Person Risk | High dependency on individuals | Reduced via automated workflows |
ESG & Regulatory Reporting | Fragmented and inconsistent | Structured and audit-ready |
The data security row is worth pausing on, because no competitor in this space addresses it directly. Emailing spreadsheets containing payroll figures, investor summaries, and revenue breakdowns is a security exposure most finance teams have normalised simply because it has always been done that way. It is not a minor risk — it is an uncontrolled data distribution problem.
The ESG and regulatory reporting row matters increasingly for small mid-sized B2B businesses accounting. Frameworks like iXBRL, DORA, and evolving ESG disclosure requirements are creating structured reporting obligations that manual processes cannot consistently meet. Automated systems produce compliant, structured outputs by default — manual processes require significant rework to match.
The cost row appears most favourable for manual reporting at first glance. It is not, once you account for the full picture, which the next section addresses in detail.
The True Cost of Manual Financial Reporting: What Your P&L Is Not Showing You
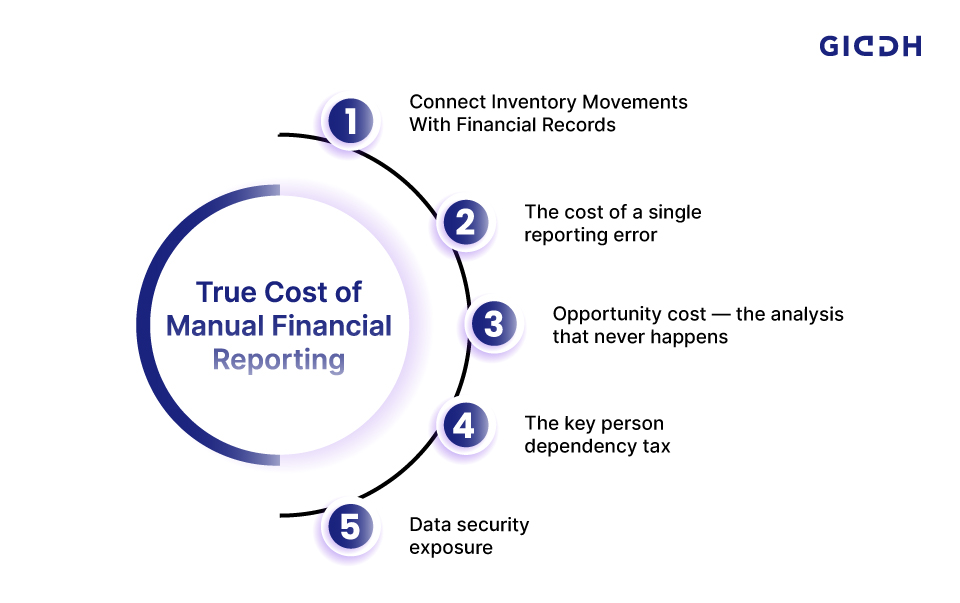
The assumption that manual reporting is ‘free’ because it uses tools your business already owns is one of the most expensive misconceptions in finance operations. Here are the five cost categories that never appear as a line item, but are very real.
1. The labour cost of reporting hours
Finance professionals spending 30–40% of their working time on data entry, reconciliation, and report formatting are not performing low-cost work. They are performing high-salary work on low-value tasks.
The calculation is direct:
Annual manual reporting cost = Average blended hourly rate × Monthly reporting hours × 12.
Example: ₹800/hour × 60 hours/month × 12 = ₹5.76 lakh per year in labour alone — before errors, overtime, or opportunity cost.
2. The cost of a single reporting error
A misplaced decimal in a board presentation. A formula that references the wrong cell in a revenue projection. A VAT figure was miscalculated across three subsidiaries. Each of these scenarios carries direct costs: correction time, compliance review time, and, in some cases, regulatory penalties or damage to investor credibility that cannot be quantified cleanly in a spreadsheet.
3. Opportunity cost — the analysis that never happens
When your finance team spends 80% of the close week gathering data, they spend the remaining time generating insights. Leadership asks Why did gross margin compress in Q3?’ and the honest answer is: nobody has had time to look. The reports get delivered. The analysis does not.
That missing analysis is where CFOs lose credibility in board meetings and where businesses make decisions more slowly than their competitors. It is not visible on a P&L, but it is very real.
4. The key person dependency tax
When reporting processes live in one person’s Excel file or in one person’s head, the business faces an undocumented operational risk. If that person is on leave, ill, or has resigned, the reporting cycle either stops or is handed to someone working from an incomplete context. This is not a failure in people management. It is a consequence of building reporting infrastructure around individuals rather than systems.
5. Data security exposure
Traditional manual reporting relies on communication channels that were not designed to securely carry sensitive financial data. Spreadsheets are forwarded via email, stored on shared drives with inconsistent access controls, and often version-controlled using file names like ‘Final_v3_ACTUAL.xlsx’. Each handoff is an uncontrolled data distribution event. Most finance teams have normalised this. That normalisation does not reduce the risk.
How to Calculate the ROI of Financial Reporting Automation Before You Commit to Anything
This is the section that most automation vendor blogs skip entirely, because an honest ROI calculation sometimes reveals that a business is not ready to switch yet — and that is a legitimate outcome worth knowing.
The formula is straightforward:
ROI = [(Annual savings from automation − Annual cost of software) ÷ Annual cost of software] × 100
Here is what that looks like for a realistic mid-sized business scenario:
- A 200-person B2B company, 4-person finance team, managing monthly reporting across 3 entities
- Manual reporting time: approximately 60 hours per month across the team
- Blended hourly cost: ₹800 per hour = ₹48,000 per month = ₹5.76 lakh per year in labour
- Add error correction time, compliance preparation, and overtime during close weeks: conservatively ₹1.5 lakh per year in additional cost
- Total annual cost of manual reporting: approximately ₹7.26 lakh
- Financial reporting automation software investment: approximately ₹1.5–2 lakh per year
- Time reduction from automation (conservative estimate): 70%
- Annual savings: ₹5+ lakh. ROI in Year 1: 167%+
Businesses that implement financial reporting automation typically achieve positive ROI within 6–12 months. The calculation above uses conservative estimates. Faster close cycles, reduced audit preparation time, and fewer compliance incidents all extend that return further.
The soft ROI matters too and should be included in any internal business case: fewer board meeting delays, faster variance analysis, analyst retention (skilled finance professionals do not stay in roles defined by spreadsheet maintenance), and the compounding benefit of having real-time data available for decisions rather than month-old snapshots.
Quick self-check: Multiply your team’s average hourly rate by the hours spent on manual reporting tasks each month, then multiply by 12. That is your current annual cost of manual reporting. Compare it to the cost of finance reporting automation software. The gap is your ROI case.
Common Pitfalls When Implementing Financial Reporting Automation — And How to Avoid Each One
Every competing blog on this topic ends with a call to automate. What they skip is the honest reality that automation implementations fail when implemented poorly. These are the failure modes worth knowing before you start.
Automating a broken process
Automation accelerates whatever process you feed it. An automated, flawed workflow is a flawed workflow running faster. Before selecting any financial reporting automation software, document your existing reporting process at the step level. Fix the process logic first. Automate the corrected version.
Weak change management
Finance teams that have worked in spreadsheets for years do not automatically trust new systems. If leadership does not actively communicate the rationale for change and frontline finance staff are not involved in the transition process, adoption will be slow, and reversion to manual workarounds will be common.
Poor system integration
A financial reporting automation tool is only as good as the data it can access. If your ERP, accounting platform, and payroll system do not connect cleanly through APIs, you end up with manual data exports feeding an automated report, which eliminates most of the value. Verify integration compatibility before commitment.
Skipping structured training and onboarding
Finance teams that receive no structured onboarding for new automation tools default to what they know. They build manual workarounds. They maintain parallel spreadsheets ‘just in case’. Those parallel processes consume time, create version conflicts, and ultimately undermine the investment in automation.
No defined success metrics
If you do not measure your current close cycle time, error rate, and hours spent on reporting before implementing automation, you have no baseline against which to demonstrate improvement. Define three to five metrics before go-live. Measure at 30, 60, and 90 days post-implementation. This is how you prove ROI internally and sustain leadership support.
What to Look for in Financial Reporting Automation Tools and Software
Most ‘top tools’ lists tell you what popular software exists. This section tells you what capabilities to require before selecting any financial reporting automation software — regardless of brand or price point.
-
Real-time ERP and accounting solution integration — data should flow automatically through live API connections, not through scheduled exports or manual uploads.
-
Automated reconciliation with discrepancy flagging — the system should surface mismatches proactively, not after a human reviews the numbers.
-
Customisable report templates — board-ready, management-level, and regulatory formats, configurable without IT involvement.
-
Built-in audit trail — every change, calculation, and access event logged, timestamped, and exportable for compliance review.
-
Role-based access controls — CFOs see consolidated group-level data; department heads see their scope only; no over-sharing of sensitive financial information.
-
No-code or low-code workflow design — finance teams should be able to build and modify report workflows without raising IT tickets.
-
AI-assisted anomaly detection — flags statistical outliers and unusual variances before they become errors in a distributed report.
-
ESG and regulatory compliance support — increasingly non-negotiable for businesses facing iXBRL, DORA, or sustainability disclosure requirements.
-
Multi-entity and multi-currency capability — handles consolidated reporting across branches, subsidiaries, or cost centres without custom development.
94% of business professionals at enterprise companies say they would prefer a unified platform that integrates applications and automates workflows over managing multiple disconnected systems. — BILL Research
How Giddh Simplifies Financial Reporting Automation for Mid-Sized Finance Teams
Most financial reporting automation software falls into one of two categories: enterprise platforms built for organisations with dedicated IT teams and six-figure implementation budgets, or lightweight tools that handle basic bookkeeping solutions but cannot manage multi-entity reporting, compliance outputs, or real-time consolidated views.
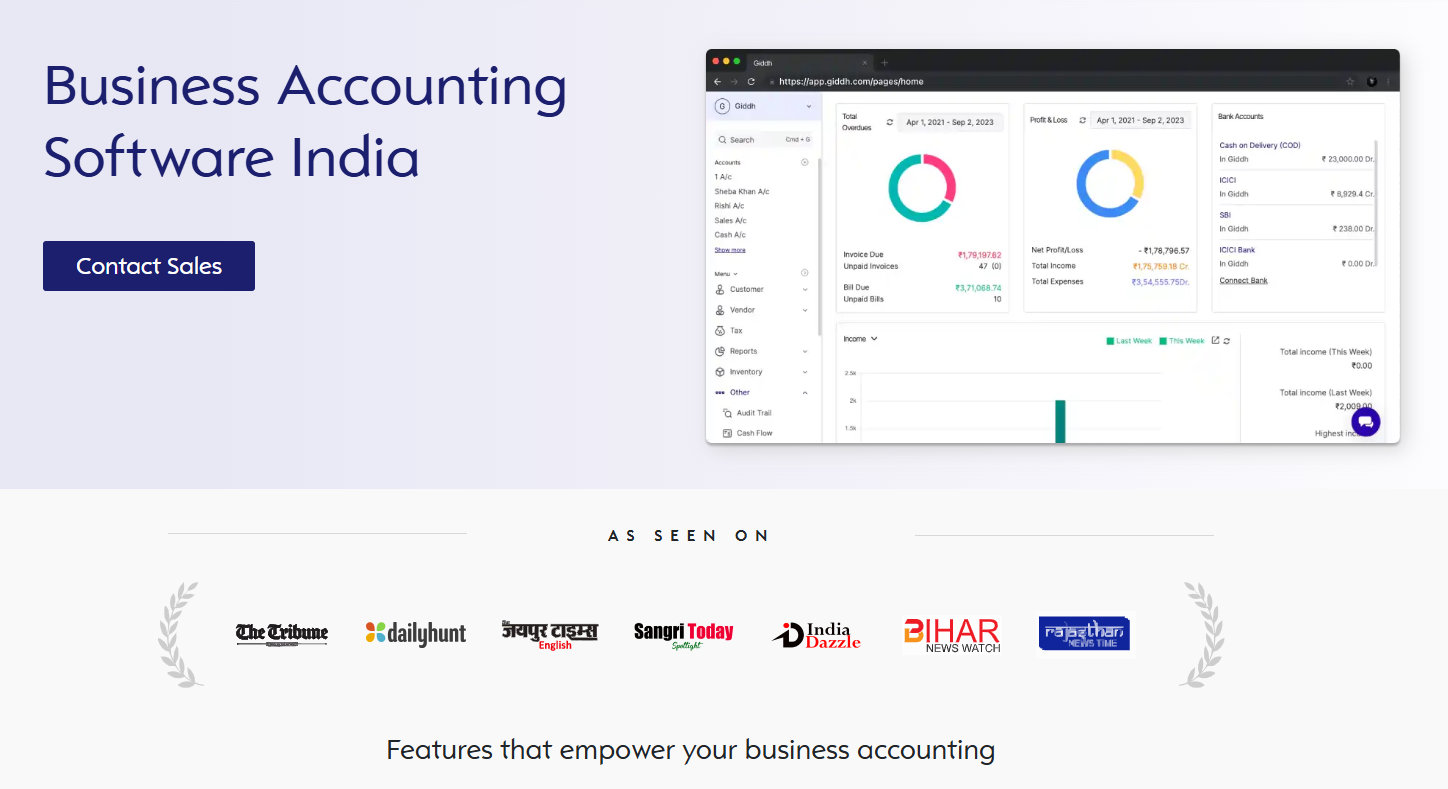
Giddh sits in a completely different position. It is purpose-built for growing B2B businesses — companies with 50 to 500 employees that need the reporting capabilities of larger platforms without the complexity or cost that comes with them.
Three areas where Giddh directly addresses the pain points this guide has outlined:
-
Auto-generated financial reports — P&L statements, balance sheets, and cash flow reports are produced automatically from connected account data. No manual assembly, no formula maintenance, no version control issues.
-
Real-time transaction sync — account data updates continuously, which means your reports reflect the current reality rather than a snapshot from the last time someone ran an export.
-
Multi-branch reporting — manage multiple entities, branches, or cost centres within a single platform, with consolidated and segmented views available without building separate spreadsheet models for each.
For Finance Managers and CFOs who have completed the self-assessment above and identified themselves as at or past the tipping point, Giddh removes the usual barriers to implementation: no IT team required, no multi-month setup timeline, and no enterprise-scale pricing model.
How to Move from Manual to Automated Financial Reporting: A Practical Starting Point
The transition from manual to automated reporting does not have to be a complete system overhaul. The most effective implementations start narrow and expand deliberately.
-
Step 1: Audit your current process — Audit your current process — document every manual step, every data source, every hand-off, and every tool involved in your current reporting cycle. Most finance teams discover redundancies and inconsistencies they had not formally mapped before.
-
Step 2: Identify your highest-pain points — Identify your highest-pain points — where do errors occur most frequently? Where does time go disproportionately? Start the automation conversation there, not with the most technically complex report.
-
Step 3: Clean your data before you automate — an inconsistent chart of accounts, duplicate vendor records, and mismatched cost centre codes will propagate through automated reports just as they do through manual ones. Data hygiene is not optional.
-
Step 4: Choose the right software — Choose accounting automation software that matches your stack — compatibility with your existing ERP and accounting platform is a non-negotiable starting point. Evaluate the depth of integration, not just the claims of integration.
-
Step 5: Pilot on one report type first — Pilot on one report type first — automate your P&L before anything else. Validate the outputs against your manual version. Build confidence in the system before expanding to balance sheet, cash flow, and management reporting.
-
Step 6: Define baseline metrics, train, and measure — Define baseline metrics, train, and measure — record your current close cycle time, hours spent, and error rate before go-live. Review at 30, 60, and 90 days. This data is how you demonstrate ROI internally and sustain the change.
Conclusion
Manual financial reporting played an important role in the early stages of many businesses. For small companies with limited transaction volume, spreadsheets still work reasonably well.
However, as organizations grow, manual reporting quickly becomes a constraint.
More transactions mean more data consolidation. More stakeholders mean more reporting requests. Leadership wants faster insights and better forecasts.
Financial reporting automation addresses these challenges by connecting financial systems, eliminating manual data entry, and generating accurate reports in real time.
The benefits extend beyond operational efficiency. Automation improves financial visibility, reduces reporting risk, and frees finance professionals to focus on analysis rather than administration.
The decision is not simply about replacing spreadsheets. It is about building a reporting process that scales with the business.
Try Giddh financial reporting to gain a competitive advantage, as it enables you to interpret financial signals faster than your competitors.
Frequently Asked Questions
What is financial reporting automation, and how does it work?
Financial reporting automation collects financial data from multiple systems, consolidates it automatically, performs calculations, and generates reports such as balance sheets and income statements without manual data entry.
What are financial reporting automation tools?
Financial reporting automation tools are software platforms that integrate financial systems, automate data consolidation, perform calculations, and generate real-time financial reports for finance teams and leadership.
How long does it take to implement financial reporting automation software?
Implementation time depends on system complexity and the number of integrations. Most mid-sized companies can implement financial reporting automation software within four to eight weeks.
What financial reports can be automated?
Most standard financial reports can be automated, including income statements, balance sheets, cash flow reports, expense summaries, financial forecasts, and variance analysis reports.
Can financial reporting automation replace accountants?
No. Financial automation tools remove repetitive tasks such as data entry and reconciliation. Accountants remain responsible for financial analysis, interpretation, and strategic decision support.